
Reliability and Hardening


In the beginning, mainnet.optimism.io was just a domain alias. All the actual infrastructure was handled by QuickNode. This let us focus on developing the core protocol without worrying about how users could access the network. As we grew, we realized we needed more than a simple domain alias could provide:
- We needed the ability to create our own metrics, and alert off them.
- We needed detailed logs in order to diagnose exactly which user RPCs were failing and why.
- We needed the ability to whitelist specific RPCs in order to protect the sequencer.
- We needed a way to automatically fail over to a different provider in case QuickNode experienced downtime.
- We wanted to reduce the cost of hosting the public endpoint.
Additionally, we had an anti-goal: don’t become an infra provider ourselves. Our public endpoint sees about 100 million daily requests. Serving that many requests is hard, and running node infrastructure isn’t our core business. Therefore, we needed to solve the above problems without requiring us to operate public nodes ourselves.
Part 2: The Solution
Our solution was was to route all RPC traffic through a custom middleware layer called proxyd. proxyd lets us route individual RPCs to groups of upstream infra providers (called “backends” in the config). When one of the backends in a group fails, proxyd automatically marks it as out of service for a configurable period of time and fails over to another provider. proxyd also supports RPC method caching and exposes a rich set of Prometheus metrics to analyze RPC usage.
It’s configured using a TOML file that looks something like this:
[backends]
response_timeout_seconds = 5
max_retries = 3
out_of_service_seconds = 30

[backends.infura]
rpc_url = "..."
ws_url = "..."

[backends.alchemy]
rpc_url = "..."
ws_url = "..."

[backend_groups]
[backend_groups.providers]
backends = ["alchemy","infura"]

# Mapping of methods to backend groups.
[rpc_method_mappings]
eth_getBalance = "providers"
Here, eth_getBalance calls are routed to Alchemy. If Alchemy fails, calls will be routed to Infura for 30 seconds. After that, proxyd will attempt Alchemy again.
We spent roughly a month testing proxyd on Kovan before deploying it to mainnet. Here are some of the most interesting things we learned along the way:
- Infrastructure providers have subtle, often-undocumented limits that deviate from the canonical RPC implementation in Geth. When these limits are hit, they are returned to users directly and don’t trigger an alert of any kind. As a result, our metrics had to track not just the RPC methods being requested but also the raw error codes returned by the upstream provider.
- Very few applications use WebSockets or RPC batching. The vast majority of our HTTP requests contain a single RPC call. This was an important factor while designing our rate limits, since a single browser session clicking through a dApp could initiate thousands of HTTP requests per minute.
- Upstream errors happen a lot more than you’d think. They usually resolve themselves within 2-3 seconds, but they are errors nonetheless. As a result,
proxydwill retry upstream providers internally in an effort to hide these issues from users. - We ran an experiment where we requested data from three providers at once and returned the data that 2/3 of the providers agreed on. Don’t do this. It takes about 10-15 seconds for providers to come to consensus on a single block, which is too long for users to wait.
- Some of the most-requested RPC calls are trivially cacheable. These are things like
eth_chainId, which in our case was being called millions of times per day. Caching methods like that one can save you hundreds per month on your infra bill.
Part 3: Results
As of today, our proxyd cluster is on mainnet and handling roughly 100 million requests per day. So, what does this mean for users? It means:
Better Uptime
The main goal of all this work is to improve our uptime. When our public endpoint is down, it feels like OP Mainnet itself is down even though the sequencer isn’t doing anything. If we do this right, these changes should be completely transparent.
Proactive Incident Response
Previously, we had no insight over an issue’s preconditions. For example, we learned of the issues that affected the Lyra token launch only after their users started reporting problems. We have monitoring and alerts in place now that will ping our on-call engineers if anomalies occur so that we can monitor for problems before they occur.
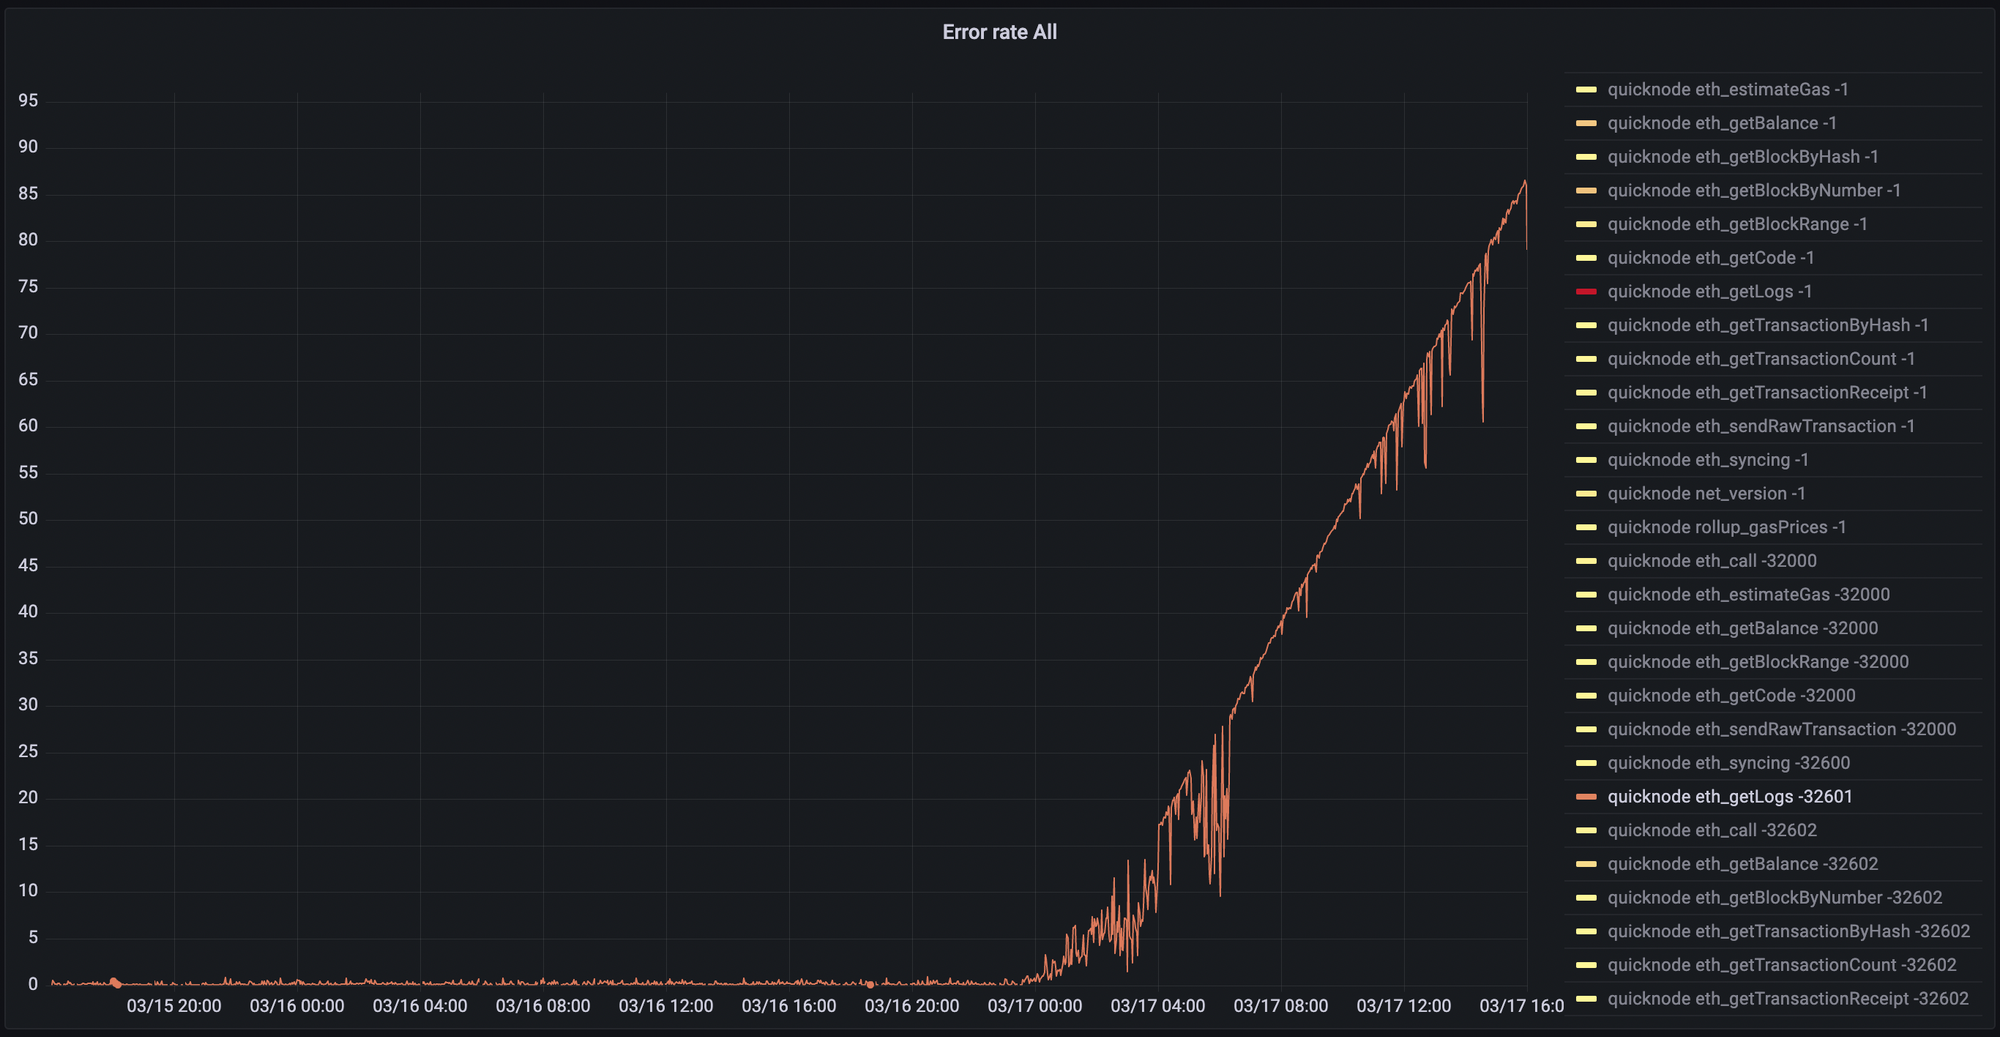
For example, here’s an anomaly we experienced recently where a user encountered a provider-specific limit, in this case QuickNode’s 10,000 block maximum on eth_getLog requests:
Better Support
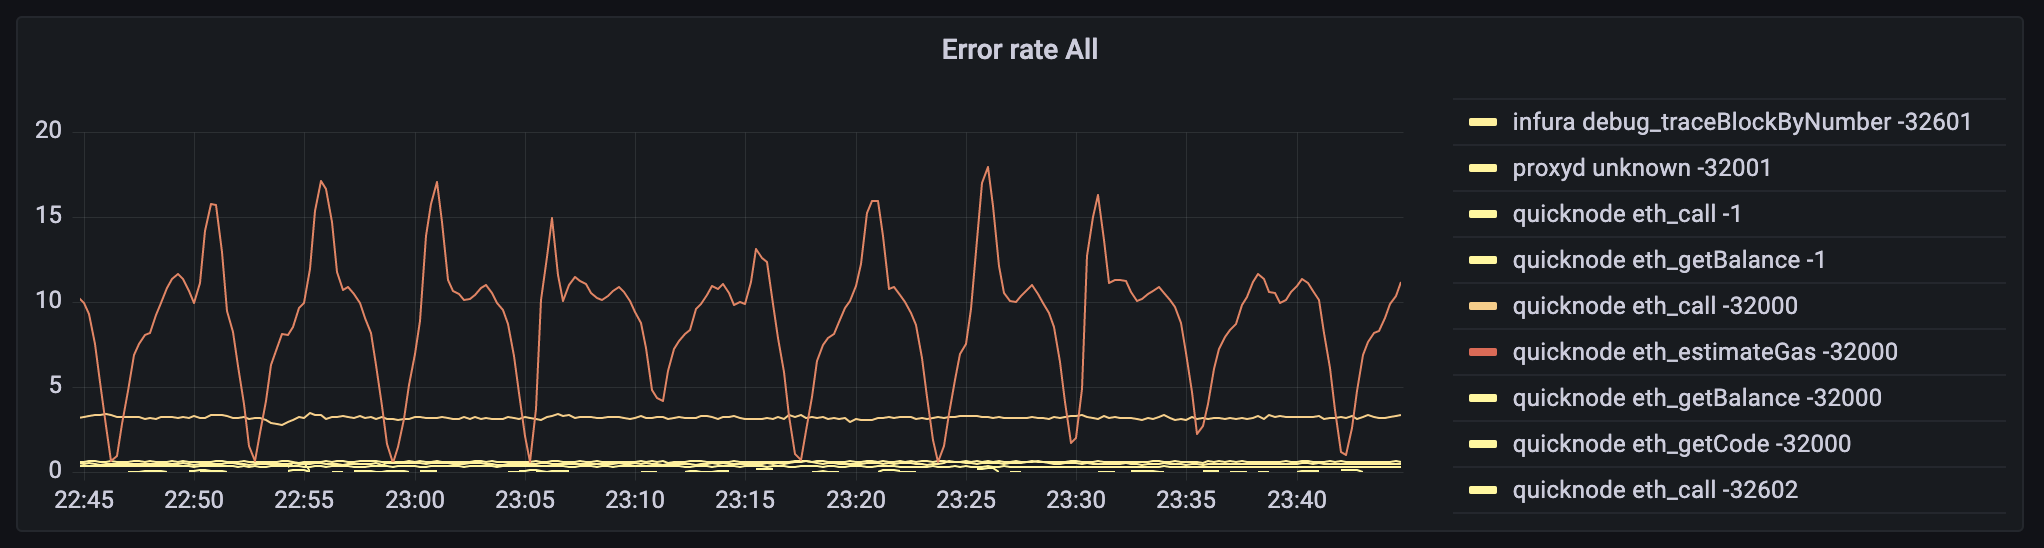
Issues may still occur despite our best efforts. When this happens, it’s important for us to be able to diagnose user problems quickly as possible. This was difficult pre-`proxyd`, since we didn’t have the ability to see detailed error information for every RPC request. Now we have a dashboard like the one below, which shows us exactly which error codes users are experiencing on a per-RPC and per-provider basis:
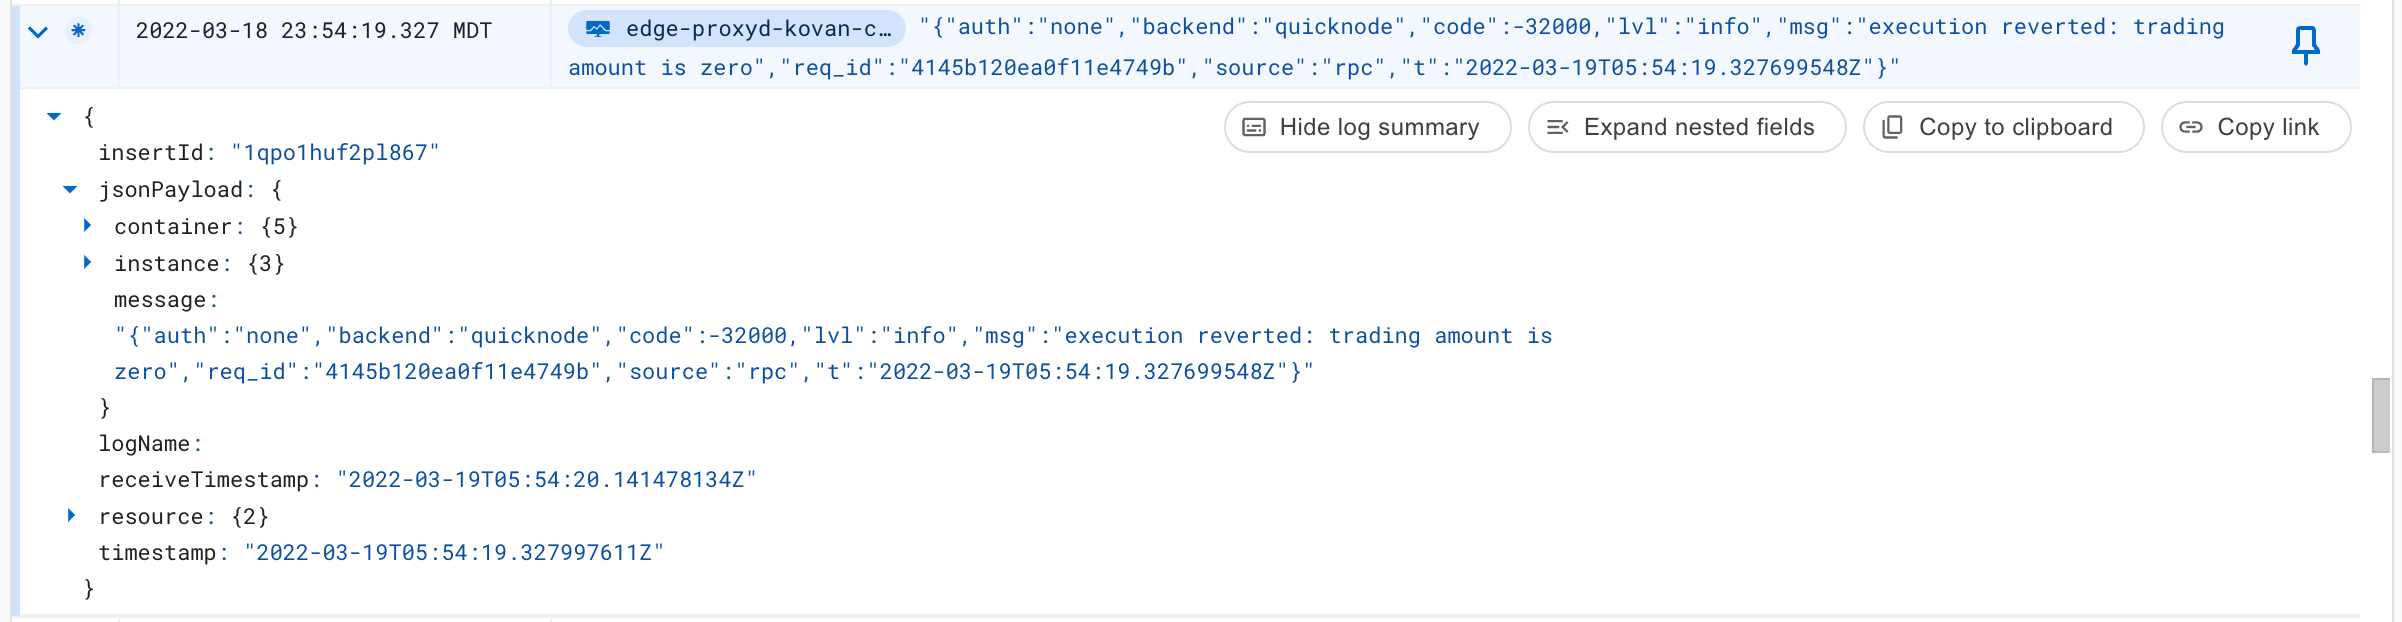
We can then hop into StackDriver, our logging tool, to see exactly the root cause of each error:
This will help short-circuit process of gathering data about why an issue happened, and help us resolve issues sooner.